
Energy and Air Filtration Expert’s Insights on Air Quality in Data Centers, Cost Savings, and Environmental Impact
By

With 15 years of experience in the air filtration industry, Mark Davidson specializes in clean air. In his current role as Manager of Marketing and Technical Materials at Camfil USA, Mark helps companies in a vast range of industries choose the right technology and develop effective procedures to protect customers, employees, products, and equipment at a lower cost than any other filter manufacturer.
Energy—few topics are discussed more than the future availability of energy, particularly electrical energy. With the increase in electric vehicle sales and the push to electrify homes, annual electrical consumption is projected to rise. In fact, global electricity usage is expected to increase by 4% this year alone. But there’s another area growing even faster, closely tied to energy and, in some theoretical circles, considered a form of energy itself: data.
If you’re reading this online, you are consuming electricity as you interact with a distant data center. Think about how often, throughout a typical day, you access data (information) that’s stored and only released when you request it. Once called for, the data is transmitted to you via electrical output, which you then read, watch, or listen to on another device powered by electricity. In today’s society, accessing or creating data is almost impossible without consuming electrical energy, and both processes are essential parts of daily life. With the rapid growth in AI usage, which consumes more electricity than standard computing methods, it's clear why some experts project that the electrical demand for data centers could double within just a few years.
Can the energy industry meet the increasing electricity demands of data centers to satisfy our growing appetite for data? Historically, the market has responded by providing the supply demanded by consumers, but not always within the desired timeframe. In the meantime, any product that reduces energy usage and lessens the strain on the grid, demands our attention.
That’s where air filters come in, particularly those designed and proven to maintain a low average resistance to airflow throughout their service life.
Resistance to Airflow, Also Known as Pressure Drop
Resistance to airflow, often referred to as pressure drop, is measured in inches of water gauge and represents the pressure differential between the upstream and downstream sides of a filter (in other words, the change in pressure between the air before and after it passes through the filter). It’s also known as delta p, denoted as ?p. Most air filter manufacturers publish performance values for their filters using procedures outlined in ASHRAE 52.2 - Method of Testing General Ventilation Air-Cleaning Devices for Removal Efficiency by Particle Size. This test method generates the familiar MERV value, which indicates how effectively a filter removes particles from the air.
Because the 52.2 test procedure uses standardized filter dimensions and airflow velocity, it allows for easy comparison of airflow resistance between filters. Most manufacturers publish the initial pressure drop (in inches of water gauge) for their products in technical specification documents and other marketing materials. While this figure is useful for comparing filters, there’s more to the story regarding resistance to airflow, especially for data centers.
Why Average Matters
When an air filter is first installed, airflow is at its maximum, and resistance (pressure drop) is at its minimum. As the filter begins to capture and hold dirt particles, air velocity slows because it becomes increasingly more difficult to navigate through the maze of dirt-covered fibers. This raises the pressure upstream of the filter while lowering airflow downstream, therefore increasing pressure drop.
A good analogy to help visualize this is a car approaching a steep hill with its cruise control set at 70 mph. As the resistance on the car increases due to gravity, the car slows down, and the desired speed is no longer maintained. In response, the cruise control increases the fuel supply to the engine to overcome the resistance, and the car speeds up to maintain the desired 70 mph.
Similarly, when a "steep hill situation" occurs in a ventilation system due to dirt building up on the filter, reduced airflow can prevent the intended conditions of the space from being maintained. To counter this, fans are often equipped with their own version of cruise control: a variable frequency drive (VFD). This device can monitor resistance and increase the speed of the fan to overcome and restore the required airflow. Continuing with the car versus hill analogy, a VFD adds more "fuel" (in this case, electricity) so the fan spins faster (just as the car would accelerate), restoring airflow to the intended velocity.
However, increasing fan speed comes at a cost. Each step up in speed requires more electrical energy. The longer a filter can go before the pressure drop rises to the point where the VFD demands an increase in fan speed, the lower the system’s overall energy use. This is why the average pressure drop of an air filter over its service life is more valuable to know than the initial pressure drop when the filter is brand new.
Understanding the Curve
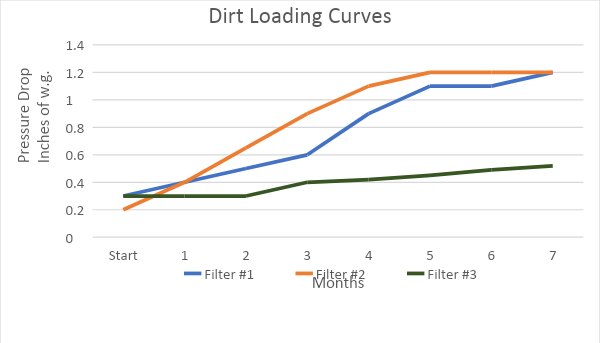
How do you determine the average pressure drop of an air filter, and how can you compare different filters? One approach is to create a dirt-loading curve. This involves recording pressure drop readings over time for multiple filters and creating curves that show resistance over time. The example below shows readings taken monthly for three different filters over seven months.
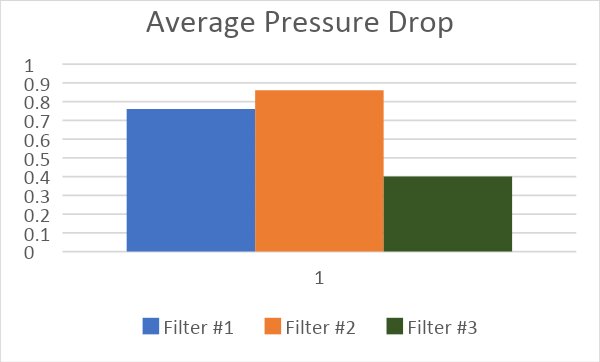
Among the three filters (assuming all had equal MERV values), Filter #3 would be the best choice despite having a higher initial pressure drop because its average over seven months was 0.40", compared to 0.76" for Filter #1 and 0.86" for Filter #2.
Modeling Likely Scenarios
Taking readings on different filters over several months isn’t practical. Fortunately, there’s another way to determine the likely average pressure drop of an air filter in a particular application and that’s the use of software that uses data to model or forecast future events or scenarios.
Forecasting software has been around for decades and is used in many industries in one form or another. A familiar example is the software used to predict the weather. While weather forecasts are often the subject of jokes, the reality is that today’s five-day forecast is as accurate as a 24-hour forecast was 40 years ago. The accuracy of weather modeling software has saved countless lives and hundreds of millions of dollars by providing advanced warnings of dangerous weather.
To achieve this, atmospheric data is collected and shared freely from publicly funded satellites, probes, and other equipment. Weather forecasting software then uses this data to model future scenarios by evaluating new data against historical data, creating a forecast for what we can expect over time. Finally, the human element comes into play and the experience of a seasoned weather professional makes the final tweaks to the forecast.
Every local news program has a weather segment, so every filter manufacturer collects data and develops software to model air filter performance forecasts, right? Not quite.
Camfil is the only filter manufacturer that has invested in designing, building, maintaining, deploying, and collecting filter performance data from multiple mobile filter testing laboratories known as CamLabs. It is this data, along with data from in-house lab testing and on-site in-situ tests, that air filter modeling software uses to predict how an air filter will perform in various situations.
Abundant and Accurate Data is Key
Just like weather forecasting, the first step in modeling air filter performance is to collect data. Camfil does this by parking one of their CamLabs at a client’s facility for months at a time to conduct filter comparison tests. These labs contain four identical test ducts, each configured to hold two stages of air filtration, mimicking the air handling units typically found in commercial, healthcare, and industrial facilities.
The lab is positioned as close as possible to the facility’s actual air handling units. Each of the four ducts is outfitted with different brands or styles of both pre and final air filters. Once the test begins, the units draw in 100% outside air for up to six months. Instruments record the condition of the air upstream of the filters and then again downstream after it passes through the filters. While the test is conducted to demonstrate the optimal air filtration solution for a specific client or facility, all the data collected is added to a massive database containing information from previous tests as well as data from in-situ testing and in-house lab settings.
Life Cycle Costing Modeling Software (LCC)
The CamLabs are an achievement in their own right, but it’s the software that provides an accurate forecast of a filter’s likely performance in a given scenario.
An air filter is a surprisingly complex item. It is composed of various components made from different materials and comes in a wide range of sizes and styles. Each of these variables affects how the filter captures particles of different sizes and chemical compositions under varying air conditions such as temperature, humidity, and pressure. Due to the multitude of variables, it is far too complicated to model accurately in a spreadsheet.
However, the LCC software is powerful enough to consider the filter’s construction and compare those variables against actual performance data from filters made with similar materials, shapes, and configurations. This allows the software to model dirt-loading curves under different environmental conditions. From these dirt-loading curves, pressure drop projections are created, enabling accurate predictions of the energy required to operate one filter compared to another.
In the example below, the local environmental conditions of a specific facility were entered into the LCC software as a starting point. This data includes not only ambient air quality information from sources such as AirNow.gov but also the condition of the air within the facility and the percentage of recirculated air. This is vital because it determines how much dirt the filters will encounter over a given period of time. The more raw data entered about the facility's condition, the more accurate the modeling will be.
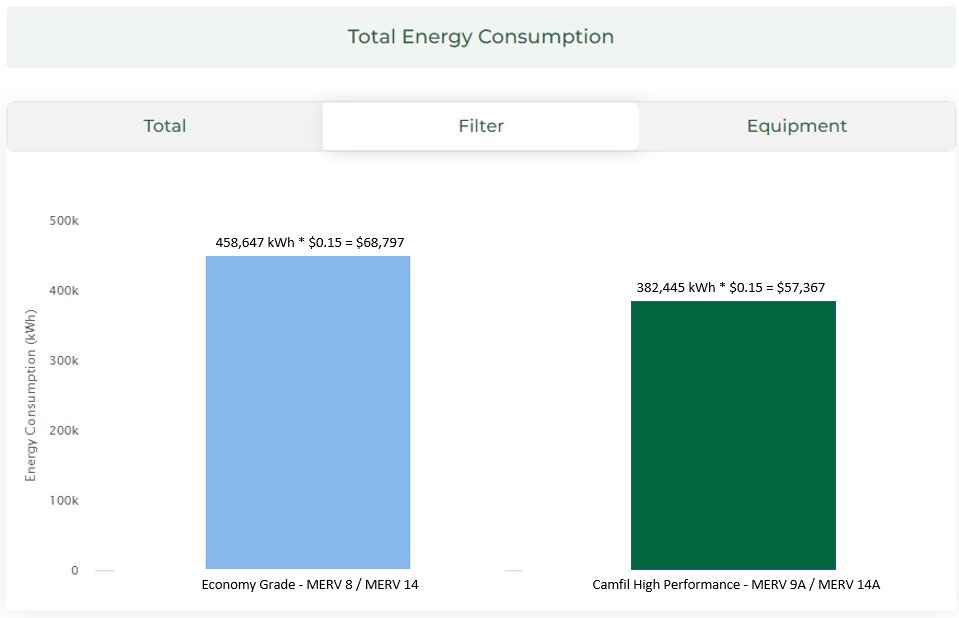
Next, two air filtration solutions were selected for comparison. The first set of filters included economy-grade MERV 8 prefilters in stage one, followed by economy MERV 14 box-style filters in stage two. These were compared against a pair of high-performance filters from Camfil: a MERV 9A prefilter followed by a MERV 14A V-bank style final filter. These filters were modeled as if they were installed in a typical air handling unit with an airflow capacity of 40,000 cfm (cubic feet per minute), with 20 filters in each stage to produce a common air velocity of 500 fpm (feet per minute) through the filters.
The results were dramatic. Over a five-year period, the lower-priced economy-grade air filters would consume over 450,000 kWh of electricity, compared to only 382,000 kWh for the higher-priced but lower operational cost high-performance filters. From a financial standpoint, the cost difference over five years was well over $11,000 for just one air handling unit. Note: these figures do not include additional cost savings from high-performance filters, such as lower product, labor, and disposal costs.
It would take many months, if not years, of regularly recording the conditions of two different sets of air filters to determine this data. With the LCC modeling software, these calculations can be done in minutes. It’s worth noting that the LCC modeling software has been used for many years and even validated by third parties to the degree that the performance forecasts between different sets of air filters have been the basis for governmental rebates issued to end users.
Energy-Saving Strategies Demand Attention
Energy is a vast and complex topic, encompassing everything from creation to distribution to end usage. One area of increasing focus is efficiency: how to do more with less. The supply chain that delivers electrical energy to our facilities involves numerous companies and components, most of which we have little or no control over.
However, this doesn’t mean we are at the mercy of whatever mechanisms dictate either the supply or the price of electricity. There are strategies that can conserve electrical usage and reduce operational costs, but they require a deeper understanding of products we often take for granted.
Air filters are one such product. Understanding how they accumulate dirt, how this affects airflow resistance, and the subsequent impact on electricity consumption gives facility managers—particularly those overseeing high-volume operations like data centers—a degree of control over energy costs that they may not have realized was possible.
Information contained on this page is provided by an independent third-party content provider. XPRMedia and this Site make no warranties or representations in connection therewith. If you are affiliated with this page and would like it removed please contact pressreleases@xpr.media
